Fundamentals of astrological datamining
This article proposes a method to improve predictability of sigma events in the future by analyzing past sigma event data sets against planetary (aka astrological) datasets.
An algorithm firstly scans a dataset and identifies relevant sigma events, their time stamp, geolocation and magnitude. Secondly the algorithm identifies the planetary positions for each sigma event and lastly it seeks the presence of planetary patterns (vectors) underlying the presence of said sigma events.
If planetary vectors can be identified then relevant policies and actions can be implemented to reduce the severity of sigma events into the future and improve system behavior and stability in a desired way.
The applicability of such algorithms could be in the domain of traffic pattern prediction, hospitalization rate predictions, surgery success rate and recovery time predictions and all sorts of events for which long standing datasets are available.
Introduction
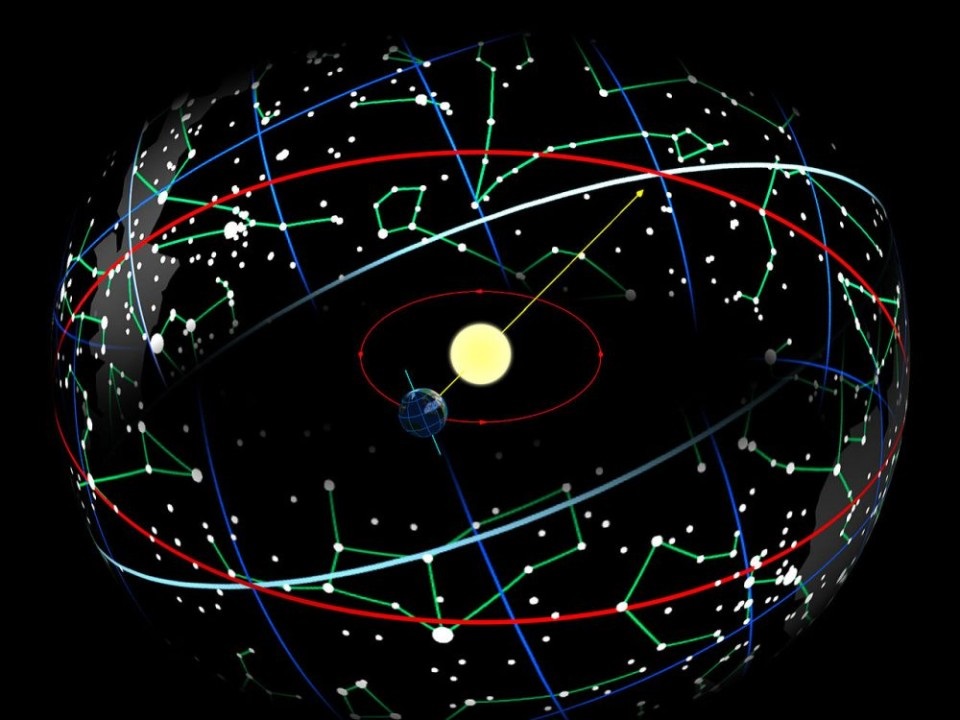
Astrology has been so far confined to the domain of magic and fantasy however it is indeed suspected that many behavioral aspects of human and biological activity are in synch with certain planetary positions such as the Sun (considered a planet in astrology tradition) and the Moon, with other secondary planets suspected of also playing some roles and influencing overall behavior of certain systems and activities.
If astrological influences are playing a role in complex system behaviors then these influences (sigma events) should be measurable against the relative position of planets within the Solar System, and specific Planetary Background Vectors (PBV) shall be clearly identifiable within a dataset thus allowing the possibility to predict when, in the future, certain sigma events are bound to repeat and happen with high statistical confidence.
The substrata
A substrata is hereby defined as a complex system on which a planetary background (PB) exerts a certain measurable influence by altering the system behavior or output or any other measurable parameter of said system.
The system is then described by a dataset in which each line contains:
1) A time stamp of the event/measure taking place within the system.
2) A geolocation stamp of where the event is taking place.
3) At least one parameter y(1) which is the variable or behavior of interest of said system or ideally its Standard deviation (SD) magnitude with its + or – sign.
Few examples of substrata are road networks of major metropolitan areas and the Y parameter of interest could be the traffic data or average commuting time of a given time or day.
It could be the number of hospitalizations per day in a hospital, the success rate of surgeries, or the recovery time after a surgery, potentially also market crash events, and so on and so forth.
Not all substrata are created equal or behave in the same way against similar Planetary Backgrounds (PBs). The traffic patterns and behaviors of a big metropolis can be very different from the ones of a small town in the middle of a desert for which different rules are at play and therefore different PB could be relevant.
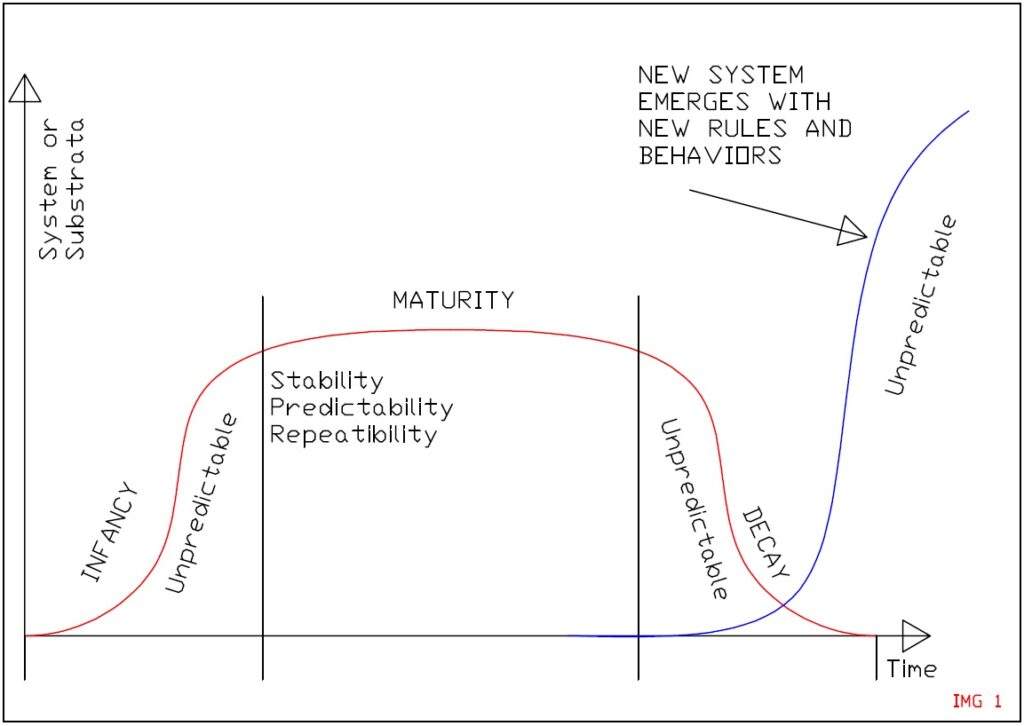
The definition of substrata underlines the concept of Rule Sets (RS) at play within the system under examination such as people commuting to work every day and using the same mix of available technologies and infrastructures to do so. A certain rule set is only stable for so long before new rules and behaviors take hold (imagine the exponential implementation of work from home policies and how these impacted upon traffic patterns).
Changes in technologies and habits induce modifications of the Rule Sets and the relative influence of Planetary Background Vectors (PBVs).
Still it is possible to identify certain systems with long established maturity in terms of technological and social background which implies the existence of a plateau of stability during which clear rule sets are at play and therefore the influencing Planetary Background Vectors can be clearly and reliably identified.
Market data can be an example of substrata variation and evolution when considering central bank interventions in the stock markets. Here we can see how the old investment savvy rules and strategies are being superseded by the advent of market apps and retail type investing strategies not available too long ago. This change in the Rule Set or technology availability causes the old set of behaviors and strategies to yield less predictable outcomes as opposed to previous periods of market strategy long held stability.
The planetary background vector (PBV)
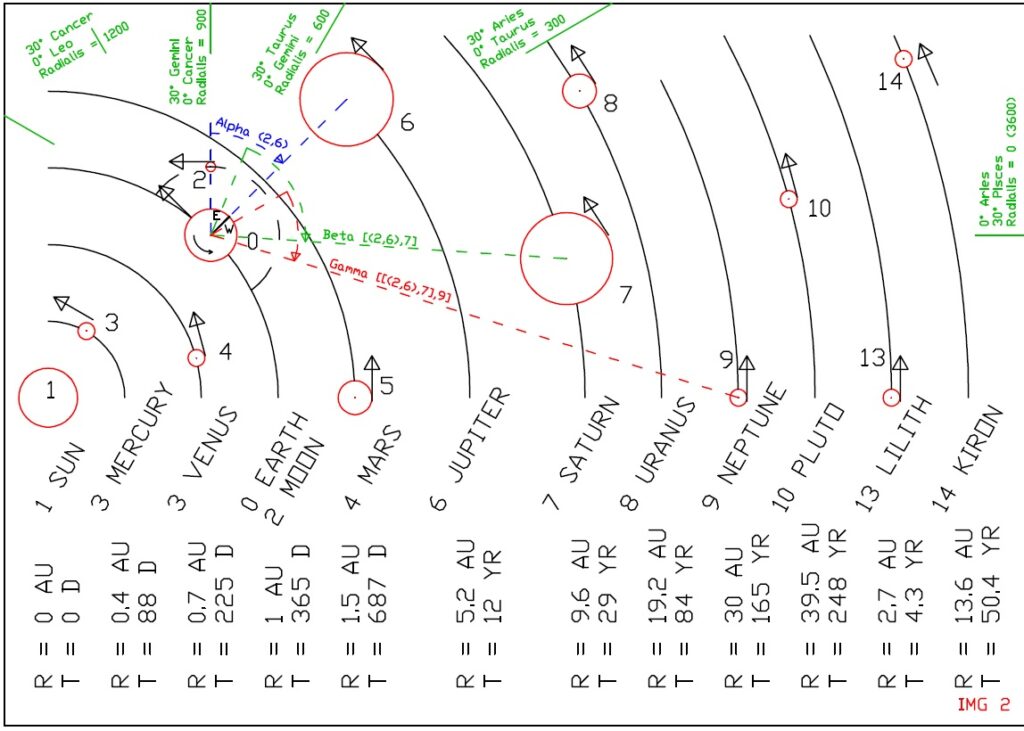
Planetary backgrounds, also called Astrological backgrounds are well documented datasets to the past and have been easily extrapolated into the future within broadly available ephemeris tables converted into plain angles (0°to 360°).
A number of planetary background types can be used, the simplest one is the binary form followed by tertiary and quaternary ones in line with the astrological tradition or even more planetary combinations could be used.
A binary planetary background vector centered around 2D angle values is defined as follows:
1)〖PB〗bin (t)=[α((1,2) ) (t),α((1,3) ) (t),…,…,α((n-1,n) ) (t)]
A ternary planetary background vector is defined around 2 x 2D angles as follows:
2) 〖PB〗ter (t)=[(α((1,2) ) (t),〖 β〗(1,2),3),(α((1,2) ) (t),〖 β〗(1,4),5),…,…,(α((n-2,n-1) ) (t),〖 β〗_(n-2,n-1),n)]
Additional imaginary planets should be added in line not just with the astrological tradition but also in accordance to obvious substrata behaviors, the main ones being:
1) The daytime planet (formerly the house position) being a translation of the local 0 – 24 HR into a 0°-360°angle, since the day and night cycle have a major influence on system activities.
2) The season planet to be multiplied by the Sin of the local latitude. This is formerly the astrological sign background being -180 on the 21st of December and +180 on the 22nd of June (beware of the precession of the equinox causing these dates to drift over the centuries!).
The justification for this imaginary planet is that people and system behaviors are different in Summer as opposed to Winter so this is an obvious influence we cannot ignore and we therefore reduce it into a plain angle (easy to elaborate for a computer) as opposed to an abstract sign reference.
3) Lastly we should introduce a weekday planet (0°on early Monday morning and 360°on late Sunday evening) which is relevant for datasets linked to human activities but has no relevance for natural type datasets (animals or bacteria don’t modify their behavior because of weekends unless such a system is intertwined with a nearby human biome).
4) A Bank Holiday planet also has obvious inductions in people behaviors.
See how planets are hereby reduced to a sequential number entity, meaning the algorithm needs not to know the name of the planet nor its historical astrological traditional meaning and supposed influence on people’s behavior.
If a binary (or tertiary or quaternary) position of any such entities matches sigma events on a given dataset then that position (vector) is all the algorithm needs to know to be able to identify when this same vector will occur in the future and that deviation is supposed to occur once again.
Dataset analysis
The dataset under investigation (Date+time, Lat+Long, Standard deviation magnitude) is expanded to include the PBV columns as follow through interpolation of ephemeris tables as well as the variable standard deviation with its + or – sign:
3) PB(t1)=[α((1,2) ) (t1),α((1,3) ) (t1),…,…,α((n-1,n) ) (t1),], Y1 PB(t2)=[α((1,2) ) (t2),α((1,3) ) (t2),…,…,α((n-1,n) ) (t2),], Y2
…
4) PB(tm)=[α((1,2) ) ™,α((1,3) ) ™,…,…,α_((n-1,n) ) ™,], Ym
Note: Just binary planet positions considered in this example, trinary and quaternary positions should be included for a more detailed analysis.
Of all the planetary pair columns not all of them might be relevant depending on the dataset time span defined as the difference (in days) between the maximum data available and the minimum date available.
Imagine the Moon to Sun planetary pair column with a cycle time of 28 days.
If a dataset only spans one or two days then all the SD counts will crowd around a narrow Moon-Sun angle and this column will hardly be relevant.
Alternatively if a dataset spans many years of data observation and recording then the Moon-Sun column will be relevant to the analysis.
Also to remember that certain planetary cycles span one hundred years or more, meaning we don’t necessarily have enough dataset span and reliable data to meaningfully measure the influences of these kind of planets (more on this subject later on this paper in relation to the Coronavirus pandemic and its predicted frequency).
A planetary pair column (also hereby referred as vector) is only relevant to the analysis if its simplified cycle time is smaller (ideally many times smaller) than the dataset time span available.
Reduction of the dataset SDs to angle based gaussians
Through these tables it is possible to identify the planetary position (angles) most unfavorable to a certain event (Alpha = Ro 1, 2, etc) as well as the most favorable angles (Alpha = Tau 1, 2, etc and following).
By looking up the ephemeris tables into the future (or simply by adding to a Ro vector or Tau vector simplified cycle time), it is possible to predict when a certain undesirable (or desirable) SD deviation is bound to occur again into the dataset future.
Closing the information loop with the substrata
Once one or more astrological correlations have been established for a certain substrata dataset it is possible to implement certain policies to alter the substrata behavior and suppress Ro (undesirable) events and increase Tau (desirable) ones.
For example by knowing in advance a certain day will be particularly bad for traffic then work from home alerts might be issued to reduce the Ro event magnitude for that day and possibly squish it down into the negative (aka Tau ergo favorable) territory.
Similarly surgeries might be scheduled at more favorable times as opposed to less favorable ones, and so on and so forth.
By implementing new policies and protocols then the substrata itself and its otherwise stable Rule Sets are now being modified through astrological datamining considerations: Undesirable positive SD deviation (Ros) are being reduced whilst favorable negative ones (Taus) are being promoted.
It is therefore logical to assume that the dataset behavior and SD fluctuations into the future will no longer resemble the SD variations of the same dataset into the past because the substrata has been technologically influenced and the rule set governing the system behavior is now influenced and modified through technological advent of astrological predictive techniques.
Certain systems are better suited than others to this kind of manipulations than others.
Traffic forecasting and preventive correction is typically a good candidate for this type of technology.
On the contrary, the implementation of astrological market trading rules and strategies inspired by astrological data associations will quickly spoil the rule set and the behavior of market participants so these algorithms are not really suited for stock market predictions unless a very small number of participants are aware of such predictive algorithms and people are keeping these algorithm secrets (which can only work for so long before the cat is out of the bag and everybody else starts using these).
Historical notes
This kind of technology is traditionally divided into a three steps process:
The Sauron analysis scans datasets in the past and it identifies relevant Planetary Background angles Ros and Taus influencers of a system modeled against a Gaussian type curve.
The algorithm judges not, it only represents the behavioral status of a relatively stable system in its natural, unperturbed state, planets are just sequential numbers to be considered on an algorithmic data analysis, they do not bear any spiritual or karmic significance whatsoever.
The second step is called the Galadriel analysis where policies and strategies are examined in order to minimize negative SD (Ro) events and promote positive SD (Tau) events against the trends identified by the Sauron analysis.
Lastly the Frodo part revolves around practical ways to implement relevant policies identified above and deliver a desired improved system behavior.
Once new policies are introduced within a system then new rules and behaviors are at play within the substrata so the data collected into the future will no longer show the typical SD variations and astrological correlations highlighted during the Sauron study.
A new substrata with a new set of rules is at play, the only way to furthermore refine and optimize the new system behavior is to wait for it to mature and stabilize participant behavior (system maturity phase) and then gather enough system data for long enough time spans in order to start another iteration of the system optimization process highlighted above.
We know the how but what about the why?
If such a software can indeed identify astrological trends within datasets (assuming astrological trends are indeed at play within human behaviors) then the next question would be why are human or natural processes influenced by planetary relative positions?
Whilst the subject can easily become everybody’s guess, my personal explanation revolves around the concept of “light quality”.
Whilst the Sun provides a steady quality of light and spectrum, the presence of other bodies reflecting more or less light back at the Earth with different angles and at different colors (even though very feeble ones when compared to the Sun’s), well all these additional light sources from within the solar system add a flavor to the light quality we are exposed and provide a certain “flavor of the moment”.
This in turn averages down to a complex system behaving in a preferred way in response to the light quality as a function of planet positions and possibly even relative velocities and apparent magnitude of said bodies.
If light quality is what subtly influences a system behavior then it could be possible to use artificially generated light of a certain quality to artificially produce certain results or rare sigma events. Think of an operating room fitted with special light appliances capable of inducing high success rates in surgeries and other delicate operations.
Predicting the next pandemic event
According to some astrologers, pandemic events are associated to a ternary planetary configuration of conjunction between Saturn-Pluto (Alpha angle around the 0 mark) whilst being in opposition to the sun (Beta angle between Saturn or Pluto around 180 degree against the Sun).
Due to the slow moving motion of both Pluto and Saturn, the frequency of this PBV is around 98 years and in particular the conjunction shows a fluctuating motion of about 10 months (about in line with the first and second wave of Covid infection) and when it comes it is usually felt for 2 full years with two peaks in the middle.
Still it must be noted that in 100 years time span the substrata (human society and biology) has quite changed, history then repeats but in different yet similar ways since the mental health pandemic induced by the Covid pandemic flu could be more relevant and long lasting than the physical loss of life type pandemic of the Spanish flu of the years 1918.
What about the Moon?
It is pretty clear that many biological type datasets are linked to a 28 day period aligning with the Moon phase.
The explanation of this might be not so esoteric after all!
The moon provides light at night even though the Sun is down, and this provides predators with unique opportunities for an extra meal. Likewise preys feel the danger associated with a rising Moon and no kidding they are a bit on the edge.
This cycle of predator additional aggressivity and prey additional carefulness might well have been embedded into genetic memories, thus explaining these cycles within biological datasets.
The presence of other biological cycles associated to other planet’s angles without an obvious behavioral correlation is the purpose of Sauron data analysis.
Conclusions
The possibility to predict complex system behavior and output against astrological background and ephemeris tables is technologically at hand given the IT infrastructure and software resources available nowadays and capable of scanning vast datasets in small amount of times.
If dataset-astrological correlations can indeed be found this could lead to revolutionary applications on all kind of fields and drastically improve efficiency of human activities.
